Start AEM in Debug Mode

Published
Troubleshooting and debugging are crucial aspects of working with AEM, allowing developers to identify, analyze, and fix issues in their code. Since AEM projects often involve extensive custom code for Models, Services, Servlets, and Schedulers, debugging allows real-time inspection and provides valuable insights into the root cause, enabling effective fixes. To debug an AEM application, you can use Java Remote Debugging.
To use remote debugging, you must start AEM with this JVM parameter: -agentlib:jdwp=transport=dt_socket,server=y,suspend=n,address=*:9511. You can add the parameter by doing any of the following:
  • Add it to crx-quickstart/bin/start script CQ_JVM_OPTS environment variable (so your server always starts in debug mode)
  • Include it as a parameter when starting AEM with java -jar directly. For example, java -Xmx1024m -agentlib:jdwp=transport=dt_socket,server=y,suspend=n,address=*:9511 -jar aem-author-p4502.jar
You can change the port defined under …,address=*:9511,… to something that works better in your environment.
To start Remote Debugging session from Intellij IDEA, do the following:
  • From Run / Debug, add new Remote JVM Debug configuration.Remote Java Debug configuration in Intellij Idea
Open the AEM page with the component using the Java class where you've set breakpoints. For example, if you've set breakpoints in 
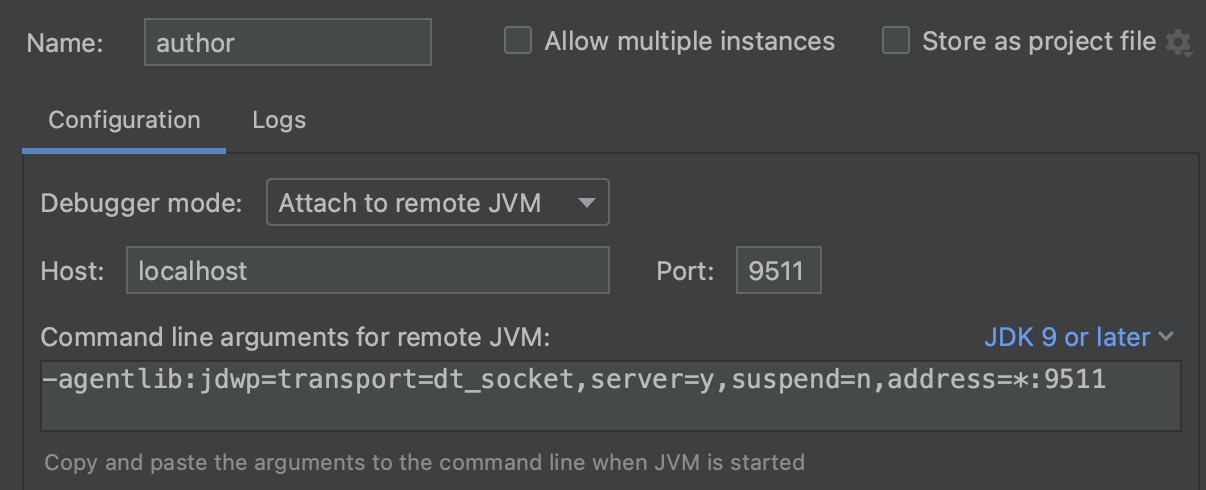
Article.java, access or refresh the page with the Article component. IntelliJ IDEA will then notify you, and the program will pause at the breakpoint.